
Cardinal Health Inc. (CAH): Price and Financial Metrics
CAH Price/Volume Stats
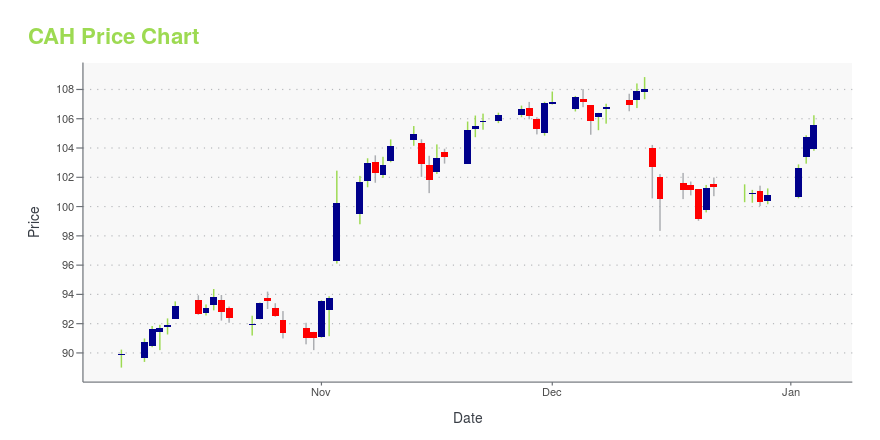
| Current price | $102.73 | 52-week high | $111.40 |
| Prev. close | $105.67 | 52-week low | $68.53 |
| Day low | $101.27 | Volume | 2,454,400 |
| Day high | $105.89 | Avg. volume | 2,295,978 |
| 50-day MA | $104.64 | Dividend yield | 1.93% |
| 200-day MA | $94.15 | Market Cap | 24.99B |
CAH Stock Price Chart Interactive Chart >
CAH POWR Grades
- CAH scores best on the Growth dimension, with a Growth rank ahead of 97.77% of US stocks.
- The strongest trend for CAH is in Quality, which has been heading down over the past 26 weeks.
- CAH's current lowest rank is in the Momentum metric (where it is better than 38.02% of US stocks).

CAH Stock Summary
- The capital turnover (annual revenue relative to shareholder's equity) for CAH is -60.2 -- better than just 0.37% of US stocks.
- With a price/sales ratio of 0.12, CARDINAL HEALTH INC has a higher such ratio than merely 2.99% of stocks in our set.
- CAH's equity multiplier -- a measure of assets relative to shareholders'equity -- is greater than that of only 1.51% of US stocks.
- Stocks with similar financial metrics, market capitalization, and price volatility to CARDINAL HEALTH INC are MKTW, HPQ, EAT, NINE, and DELL.
- Visit CAH's SEC page to see the company's official filings. To visit the company's web site, go to www.cardinalhealth.com.
CAH Valuation Summary
- CAH's price/sales ratio is 0.1; this is 97.62% lower than that of the median Healthcare stock.
- CAH's price/sales ratio has moved down 0.3 over the prior 243 months.

Below are key valuation metrics over time for CAH.
| Stock | Date | P/S | P/B | P/E | EV/EBIT |
|---|---|---|---|---|---|
| CAH | 2023-12-29 | 0.1 | -7.1 | 159.3 | 44.0 |
| CAH | 2023-12-28 | 0.1 | -7.1 | 158.4 | 43.8 |
| CAH | 2023-12-27 | 0.1 | -7.1 | 159.5 | 44.1 |
| CAH | 2023-12-26 | 0.1 | -7.1 | 159.8 | 44.2 |
| CAH | 2023-12-22 | 0.1 | -7.2 | 160.1 | 44.3 |
| CAH | 2023-12-21 | 0.1 | -7.1 | 160.0 | 44.2 |
CAH Growth Metrics
- The 3 year net cashflow from operations growth rate now stands at -71.3%.
- The 4 year revenue growth rate now stands at 19.62%.
- Its 2 year net income to common stockholders growth rate is now at 77.03%.
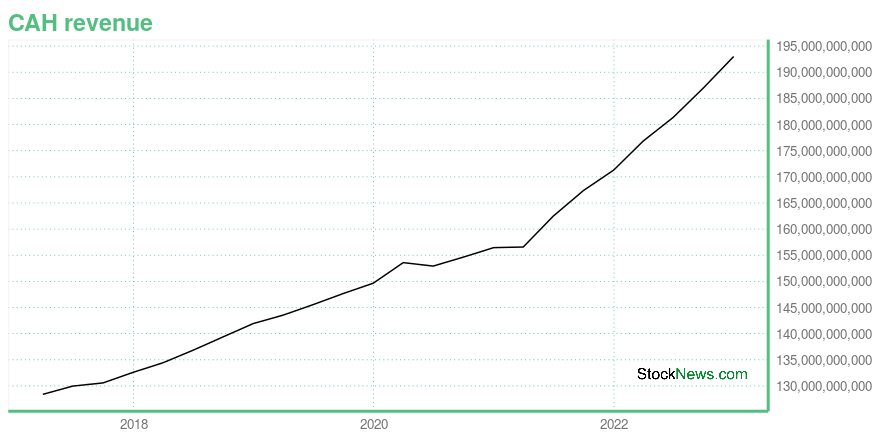
The table below shows CAH's growth in key financial areas (numbers in millions of US dollars).
| Date | Revenue | Operating Cash Flow | Net Income to Common Stock |
|---|---|---|---|
| 2022-12-31 | 193,011 | 3,193 | -1,273 |
| 2022-09-30 | 186,999 | 3,791 | -1,094 |
| 2022-06-30 | 181,364 | 3,122 | -933 |
| 2022-03-31 | 176,847 | 795 | -955 |
| 2021-12-31 | 171,286 | 1,491 | 555 |
| 2021-09-30 | 167,370 | 1,513 | 1,135 |
CAH's Quality Factors
The “Quality” component of the POWR Ratings focuses on 31 different factors of a companies fundamentals and operational strength. Here are some key insights as we drill into the specifics of these quality attributes.- CAH has a Quality Grade of C, ranking ahead of 64.17% of graded US stocks.
- CAH's asset turnover comes in at 3.718 -- ranking 10th of 105 Wholesale stocks.
- AMRK, MCK, and PETQ are the stocks whose asset turnover ratios are most correlated with CAH.

The table below shows CAH's key quality metrics over time.
| Period | Asset Turnover | Gross Margin | ROIC |
|---|---|---|---|
| 2021-06-30 | 3.718 | 0.042 | 0.047 |
| 2021-03-31 | 3.661 | 0.044 | 0.112 |
| 2020-12-31 | 3.717 | 0.045 | 0.121 |
| 2020-09-30 | 3.756 | 0.045 | 0.109 |
| 2020-06-30 | 3.773 | 0.045 | -0.332 |
| 2020-03-31 | 3.784 | 0.045 | -0.379 |
CAH Price Target
For more insight on analysts targets of CAH, see our CAH price target page. And for a list of of all stocks sorted by upside potential based on analyst target price, see our Top Price Target page.
| Average Price Target | $57.92 | Average Broker Recommendation | 1.93 (Hold) |
Cardinal Health Inc. (CAH) Company Bio
Cardinal Health, Inc. is an American multinational health care services company, and the 14th highest revenue generating company in the United States. Its headquarters are in Dublin, Ohio and Dublin, Ireland (EMEA). The company specializes in the distribution of pharmaceuticals and medical products, serving more than 100,000 locations. The company also manufactures medical and surgical products, including gloves, surgical apparel, and fluid management products. In addition, it operates one of the largest networks of radiopharmacies in the U.S.Cardinal Health provides medical products to over 75 percent of hospitals in the United States. (Source:Wikipedia)
Latest CAH News From Around the Web
Below are the latest news stories about CARDINAL HEALTH INC that investors may wish to consider to help them evaluate CAH as an investment opportunity.
Will My Portfolio’s Top 3 Performing Stocks From 2023 Deliver Again in 2024?This stock expert takes a look at his portfolio's top performing stocks from the last year. |
Best Performing Stocks In January Over The Last Two Decades (75%+ Win Rate)January is generally one of the weakest months of the year for the stock market, but the following stocks have excelled in January over the last 15 years or more. |
Are Medical Stocks Lagging Aurinia Pharmaceuticals (AUPH) This Year?Here is how Aurinia Pharmaceuticals (AUPH) and Cardinal Health (CAH) have performed compared to their sector so far this year. |
3 Top Dividend Aristocrats to Buy Ahead of 2024Some of the dividend aristocrats, such as Cardinal Health (CAH), Atmos Energy (ATO) and NextEra Energy (NEE), have a better-quality business and strong underlying fundamentals. |
Cardinal Health Inc's Dividend AnalysisCardinal Health Inc (NYSE:CAH) recently announced a dividend of $0.50 per share, payable on 2024-01-15, with the ex-dividend date set for 2023-12-29. As investors look forward to this upcoming payment, the spotlight also shines on the company's dividend history, yield, and growth rates. Using the data from GuruFocus, let's look into Cardinal Health Inc's dividend performance and assess its sustainability. |
CAH Price Returns
| 1-mo | -0.62% |
| 3-mo | -0.84% |
| 6-mo | 12.41% |
| 1-year | 31.50% |
| 3-year | 112.40% |
| 5-year | 130.90% |
| YTD | 1.91% |
| 2023 | 34.15% |
| 2022 | 54.08% |
| 2021 | -0.40% |
| 2020 | 10.09% |
| 2019 | 18.04% |
CAH Dividends
| Ex-Dividend Date | Type | Payout Amount | Change | ||||||
|---|---|---|---|---|---|---|---|---|---|
| Loading, please wait... | |||||||||
Continue Researching CAH
Want to see what other sources are saying about Cardinal Health Inc's financials and stock price? Try the links below:Cardinal Health Inc (CAH) Stock Price | Nasdaq
Cardinal Health Inc (CAH) Stock Quote, History and News - Yahoo Finance
Cardinal Health Inc (CAH) Stock Price and Basic Information | MarketWatch
Loading social stream, please wait...