Alcon Inc. (ALC): Price and Financial Metrics
ALC Price/Volume Stats
| Current price | $77.17 | 52-week high | $86.20 |
| Prev. close | $76.86 | 52-week low | $63.78 |
| Day low | $75.48 | Volume | 1,022,000 |
| Day high | $77.17 | Avg. volume | 861,144 |
| 50-day MA | $76.03 | Dividend yield | N/A |
| 200-day MA | $77.91 | Market Cap | 38.05B |
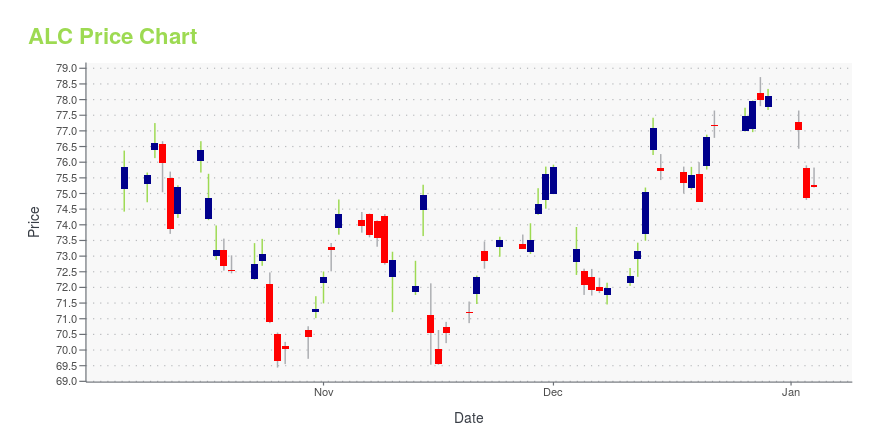
ALC Stock Price Chart Interactive Chart >
Alcon Inc. (ALC) Company Bio
Alcon is an American Swiss medical company specializing in eye care products with headquarters in Geneva, Switzerland, and incorporated in Fribourg, Switzerland. Alcon began as a US company and its US subsidiary’s headquarters remain in Fort Worth, Texas, where the Alcon division of the company was founded. (Source:Wikipedia)
Latest ALC News From Around the Web
Below are the latest news stories about ALCON INC that investors may wish to consider to help them evaluate ALC as an investment opportunity.
Alcon Inc. (NYSE:ALC) Q3 2023 Earnings Call TranscriptAlcon Inc. (NYSE:ALC) Q3 2023 Earnings Call Transcript November 15, 2023 Operator: Greetings and welcome to the Alcon Third Quarter 2023 Earnings Call. At this time, all participants are in a listen-only mode. A brief question-and-answer session will follow the formal presentation. [Operator Instructions] As a reminder, this conference is being recorded. It is now […] |
After a year of 0.8% returns, Alcon Inc.'s (VTX:ALC) share price drop last week may have less of an impact on institutional investorsKey Insights Given the large stake in the stock by institutions, Alcon's stock price might be vulnerable to their... |
Company News for Nov 16, 2023Companies In The News Are: ALC, XPEV, OLK, AAP. |
Alcon (ALC) Q3 Earnings Miss Estimates, Margins IncreaseAlcon (ALC) Q3 revenues increase year over year, driven by strength in Surgical and Vision Care segments. |
Alcon (ALC) Reports Q3 Earnings: What Key Metrics Have to SayWhile the top- and bottom-line numbers for Alcon (ALC) give a sense of how the business performed in the quarter ended September 2023, it could be worth looking at how some of its key metrics compare to Wall Street estimates and year-ago values. |
ALC Price Returns
| 1-mo | 0.65% |
| 3-mo | 5.89% |
| 6-mo | -5.07% |
| 1-year | 1.83% |
| 3-year | 3.20% |
| 5-year | N/A |
| YTD | -1.22% |
| 2023 | 13.96% |
| 2022 | -21.32% |
| 2021 | 32.04% |
| 2020 | 16.63% |
| 2019 | N/A |


Loading social stream, please wait...