
Fortinet Inc. (FTNT): Price and Financial Metrics
FTNT Price/Volume Stats
| Current price | $67.85 | 52-week high | $81.24 |
| Prev. close | $70.03 | 52-week low | $44.12 |
| Day low | $67.76 | Volume | 8,370,800 |
| Day high | $70.64 | Avg. volume | 7,800,504 |
| 50-day MA | $59.75 | Dividend yield | N/A |
| 200-day MA | $62.88 | Market Cap | 52.10B |
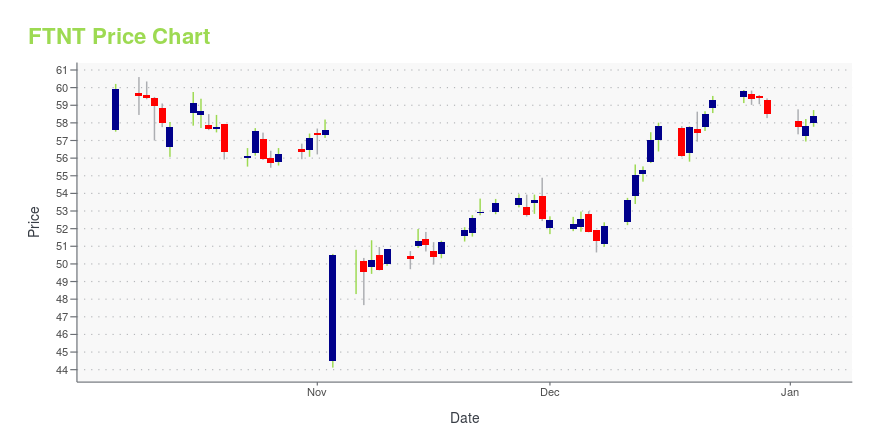
FTNT Stock Price Chart Interactive Chart >
FTNT POWR Grades
- Quality is the dimension where FTNT ranks best; there it ranks ahead of 99.44% of US stocks.
- The strongest trend for FTNT is in Growth, which has been heading down over the past 26 weeks.
- FTNT's current lowest rank is in the Growth metric (where it is better than 30.43% of US stocks).

FTNT Stock Summary
- FTNT has a market capitalization of $44,423,570,534 -- more than approximately 94.24% of US stocks.
- The capital turnover (annual revenue relative to shareholder's equity) for FTNT is 69.81 -- better than 99.68% of US stocks.
- Equity multiplier, or assets relative to shareholders' equity, comes in at 224.03 for FORTINET INC; that's greater than it is for 99.9% of US stocks.
- Stocks that are quantitatively similar to FTNT, based on their financial statements, market capitalization, and price volatility, are NCLH, SMG, BSIG, CLPR, and OPFI.
- Visit FTNT's SEC page to see the company's official filings. To visit the company's web site, go to www.fortinet.com.
FTNT Valuation Summary
- FTNT's price/sales ratio is 7.7; this is 220.83% higher than that of the median Technology stock.
- FTNT's price/earnings ratio has moved down 9.5 over the prior 171 months.

Below are key valuation metrics over time for FTNT.
| Stock | Date | P/S | P/B | P/E | EV/EBIT |
|---|---|---|---|---|---|
| FTNT | 2023-12-08 | 7.7 | 540.5 | 34.8 | 31.6 |
| FTNT | 2023-12-07 | 7.6 | 531.8 | 34.2 | 31.1 |
| FTNT | 2023-12-06 | 7.7 | 537.1 | 34.6 | 31.4 |
| FTNT | 2023-12-05 | 7.8 | 544.3 | 35.0 | 31.9 |
| FTNT | 2023-12-04 | 7.8 | 541.5 | 34.9 | 31.7 |
| FTNT | 2023-12-01 | 7.8 | 544.0 | 35.0 | 31.8 |
FTNT Growth Metrics
- The 2 year price growth rate now stands at 97.14%.
- The 5 year net cashflow from operations growth rate now stands at 147.05%.
- Its 3 year cash and equivalents growth rate is now at -24.11%.

The table below shows FTNT's growth in key financial areas (numbers in millions of US dollars).
| Date | Revenue | Operating Cash Flow | Net Income to Common Stock |
|---|---|---|---|
| 2022-09-30 | 4,098 | 1,569.3 | 742.5 |
| 2022-06-30 | 3,815.7 | 1,485.1 | 674 |
| 2022-03-31 | 3,586.7 | 1,579.9 | 638 |
| 2021-12-31 | 3,342.2 | 1,499.7 | 606.8 |
| 2021-09-30 | 3,126.6 | 1,429.4 | 554.5 |
| 2021-06-30 | 2,910.5 | 1,251.4 | 514.8 |
FTNT's Quality Factors
The “Quality” component of the POWR Ratings focuses on 31 different factors of a companies fundamentals and operational strength. Here are some key insights as we drill into the specifics of these quality attributes.- FTNT has a Quality Grade of A, ranking ahead of 98.18% of graded US stocks.
- FTNT's asset turnover comes in at 0.63 -- ranking 46th of 83 Computers stocks.
- QBAK, HPQ, and SCKT are the stocks whose asset turnover ratios are most correlated with FTNT.

The table below shows FTNT's key quality metrics over time.
| Period | Asset Turnover | Gross Margin | ROIC |
|---|---|---|---|
| 2021-06-30 | 0.630 | 0.777 | 0.328 |
| 2021-03-31 | 0.671 | 0.781 | 0.424 |
| 2020-12-31 | 0.732 | 0.780 | 0.594 |
| 2020-09-30 | 0.702 | 0.779 | 0.533 |
| 2020-06-30 | 0.674 | 0.776 | 0.507 |
| 2020-03-31 | 0.646 | 0.769 | 0.435 |
FTNT Price Target
For more insight on analysts targets of FTNT, see our FTNT price target page. And for a list of of all stocks sorted by upside potential based on analyst target price, see our Top Price Target page.
| Average Price Target | $296.32 | Average Broker Recommendation | 1.59 (Moderate Buy) |
Fortinet Inc. (FTNT) Company Bio
Fortinet is an American multinational corporation headquartered in Sunnyvale, California. It develops and sells cybersecurity solutions, such as physical firewalls, antivirus software, intrusion prevention systems, and endpoint security components. (Source:Wikipedia)
Latest FTNT News From Around the Web
Below are the latest news stories about FORTINET INC that investors may wish to consider to help them evaluate FTNT as an investment opportunity.
3 Tech Stocks to Buy Before They Take Off in 2024Investors looking for undervalued tech stocks to buy in 2024 can look at some of the same sectors that were attractive in 2023. |
25 Best Online Cybersecurity Degree Programs Heading Into 2024In this article, we will be looking at the 25 best online cybersecurity degree programs heading into 2024. If you want to skip our detailed analysis, you can go directly to the 5 Best Online Cybersecurity Degree Programs Heading Into 2024. Cybersecurity Industry: An Overview The cybersecurity industry is growing rapidly which implies bright career […] |
Cybersecurity Saviors: 3 Stocks Safeguarding the Digital FutureCybersecurity is an essential service many businesses use. |
Cybersecurity Stocks To Watch Amid Shift To AI, CloudCybersecurity stocks have underperformed in 2023. But cloud security companies may be better positioned as corporate budgets tighten. |
Fortinet Inc's Chief Revenue Officer Executes Sale of Company SharesFortinet Inc (NASDAQ:FTNT), a global leader in broad, integrated, and automated cybersecurity solutions, has reported an insider sale according to a recent SEC filing. |
FTNT Price Returns
| 1-mo | 14.23% |
| 3-mo | 33.51% |
| 6-mo | 13.69% |
| 1-year | 13.77% |
| 3-year | 112.79% |
| 5-year | 318.72% |
| YTD | 15.92% |
| 2023 | 19.72% |
| 2022 | -31.98% |
| 2021 | 141.97% |
| 2020 | 39.13% |
| 2019 | 51.58% |
Continue Researching FTNT
Want to do more research on Fortinet Inc's stock and its price? Try the links below:Fortinet Inc (FTNT) Stock Price | Nasdaq
Fortinet Inc (FTNT) Stock Quote, History and News - Yahoo Finance
Fortinet Inc (FTNT) Stock Price and Basic Information | MarketWatch
Loading social stream, please wait...