
Chevron Corporation (CVX): Price and Financial Metrics
CVX Price/Volume Stats
| Current price | $154.06 | 52-week high | $173.51 |
| Prev. close | $152.13 | 52-week low | $139.62 |
| Day low | $151.65 | Volume | 9,236,900 |
| Day high | $154.30 | Avg. volume | 9,177,630 |
| 50-day MA | $147.46 | Dividend yield | 3.97% |
| 200-day MA | $155.42 | Market Cap | 290.83B |
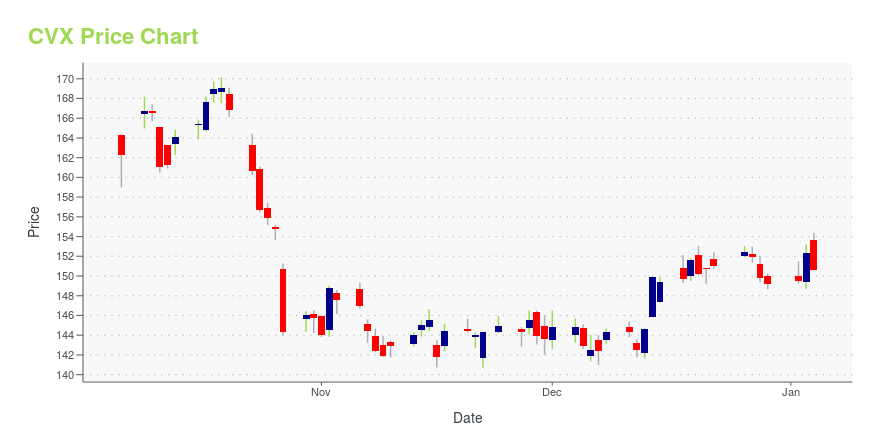
CVX Stock Price Chart Interactive Chart >
CVX POWR Grades
- Quality is the dimension where CVX ranks best; there it ranks ahead of 86.73% of US stocks.
- CVX's strongest trending metric is Stability; it's been moving down over the last 26 weeks.
- CVX ranks lowest in Sentiment; there it ranks in the 4th percentile.

CVX Stock Summary
- CVX has a higher market value than 99.45% of US stocks; more precisely, its current market capitalization is $287,560,754,139.
- CHEVRON CORP's stock had its IPO on January 1, 1986, making it an older stock than 92.92% of US equities in our set.
- In terms of volatility of its share price, CVX is more volatile than merely 6.88% of stocks we're observing.
- Stocks that are quantitatively similar to CVX, based on their financial statements, market capitalization, and price volatility, are LIN, XOM, BHP, TMUS, and BAC.
- Visit CVX's SEC page to see the company's official filings. To visit the company's web site, go to www.chevron.com.
CVX Valuation Summary
- CVX's EV/EBIT ratio is 8.2; this is 1.2% lower than that of the median Energy stock.
- Over the past 243 months, CVX's price/sales ratio has gone up 0.5.

Below are key valuation metrics over time for CVX.
| Stock | Date | P/S | P/B | P/E | EV/EBIT |
|---|---|---|---|---|---|
| CVX | 2023-12-28 | 1.3 | 1.7 | 11.1 | 8.2 |
| CVX | 2023-12-27 | 1.4 | 1.7 | 11.3 | 8.3 |
| CVX | 2023-12-26 | 1.4 | 1.7 | 11.3 | 8.3 |
| CVX | 2023-12-22 | 1.4 | 1.7 | 11.2 | 8.3 |
| CVX | 2023-12-21 | 1.4 | 1.7 | 11.2 | 8.2 |
| CVX | 2023-12-20 | 1.3 | 1.7 | 11.1 | 8.2 |
CVX Growth Metrics
- Its 5 year net cashflow from operations growth rate is now at 73.12%.
- Its 4 year net cashflow from operations growth rate is now at 73.12%.
- Its 5 year revenue growth rate is now at 14.86%.
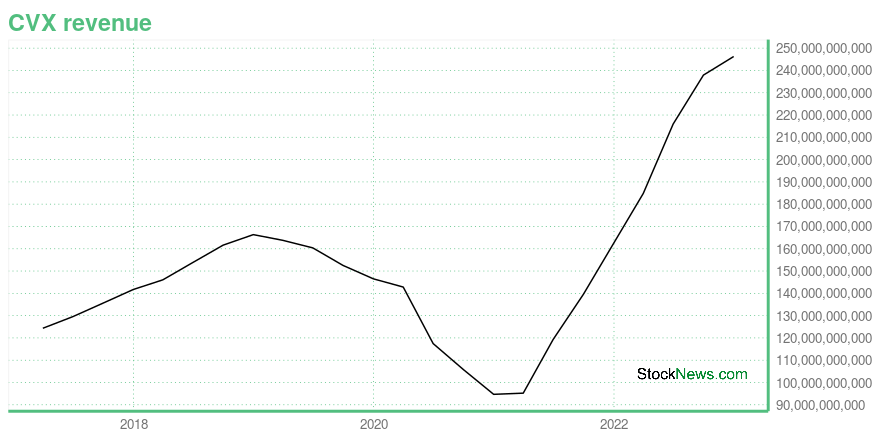
The table below shows CVX's growth in key financial areas (numbers in millions of US dollars).
| Date | Revenue | Operating Cash Flow | Net Income to Common Stock |
|---|---|---|---|
| 2022-12-31 | 246,252 | 49,602 | 35,465 |
| 2022-09-30 | 237,908 | 46,562 | 34,167 |
| 2022-06-30 | 215,974 | 39,874 | 29,047 |
| 2022-03-31 | 184,809 | 33,046 | 20,507 |
| 2021-12-31 | 162,465 | 29,187 | 15,625 |
| 2021-09-30 | 139,582 | 21,967 | 9,905 |
CVX's Quality Factors
The “Quality” component of the POWR Ratings focuses on 31 different factors of a companies fundamentals and operational strength. Here are some key insights as we drill into the specifics of these quality attributes.- CVX has a Quality Grade of C, ranking ahead of 72.57% of graded US stocks.
- CVX's asset turnover comes in at 0.504 -- ranking 49th of 137 Petroleum and Natural Gas stocks.
- MRO, BDCO, and TREC are the stocks whose asset turnover ratios are most correlated with CVX.

The table below shows CVX's key quality metrics over time.
| Period | Asset Turnover | Gross Margin | ROIC |
|---|---|---|---|
| 2021-06-30 | 0.504 | 0.248 | 0.026 |
| 2021-03-31 | 0.410 | 0.188 | -0.037 |
| 2020-12-31 | 0.410 | 0.205 | -0.029 |
| 2020-09-30 | 0.460 | 0.221 | -0.062 |
| 2020-06-30 | 0.492 | 0.238 | -0.043 |
| 2020-03-31 | 0.579 | 0.286 | 0.028 |
CVX Price Target
For more insight on analysts targets of CVX, see our CVX price target page. And for a list of of all stocks sorted by upside potential based on analyst target price, see our Top Price Target page.
| Average Price Target | $122.33 | Average Broker Recommendation | 1.65 (Moderate Buy) |
Chevron Corporation (CVX) Company Bio
Chevron engages in the petroleum, chemicals, and power and energy operations worldwide. The company operates in two segments, Upstream and Downstream. The company was founded in 1879 and is based in San Ramon, California.
Latest CVX News From Around the Web
Below are the latest news stories about CHEVRON CORP that investors may wish to consider to help them evaluate CVX as an investment opportunity.
Disaster-Proof Dividends: 3 Stocks with Resilient Payouts in Tough TimesEnjoy steady passive income and capital growth in your portfolio through these three dividend stocks with steady payouts. |
3 Energy Stocks You’ll Regret Not Buying SoonDiscover 2024's top energy stocks: Exxon Mobil, Chevron, EQT. |
Down 16% in 2023, This Dow Jones Stock Could Stage an Epic Recovery in 2024Chevron has value and income written all over it. |
The 7 Highest-Yielding Dividend Gems in Warren Buffet’s CrownWarren Buffett doesn’t hide the fact he loves dividends. |
Down in 2023, Are XOM & CVX Poised for a Turnaround in 2024?In 2024, ExxonMobil (XOM) & Chevron (CVX) are anticipated to experience a smoother trajectory, thanks to their commanding upstream operations and robust balance sheets. |
CVX Price Returns
| 1-mo | 5.74% |
| 3-mo | 8.90% |
| 6-mo | -4.25% |
| 1-year | -5.82% |
| 3-year | 90.83% |
| 5-year | 63.26% |
| YTD | 3.29% |
| 2023 | -13.63% |
| 2022 | 58.46% |
| 2021 | 46.24% |
| 2020 | -25.95% |
| 2019 | 15.27% |
CVX Dividends
| Ex-Dividend Date | Type | Payout Amount | Change | ||||||
|---|---|---|---|---|---|---|---|---|---|
| Loading, please wait... | |||||||||
Continue Researching CVX
Here are a few links from around the web to help you further your research on Chevron Corp's stock as an investment opportunity:Chevron Corp (CVX) Stock Price | Nasdaq
Chevron Corp (CVX) Stock Quote, History and News - Yahoo Finance
Chevron Corp (CVX) Stock Price and Basic Information | MarketWatch
Loading social stream, please wait...